

Pareto Chart and Fishbone Diagram in Apparel Industry
Pareto analysis and Fishbone ( Cause and Effect Diagram) are very popular and useful for quality control in the apparel […]
Pareto Chart and Fishbone Diagram in Apparel Industry Read Post »
Pareto analysis and Fishbone ( Cause and Effect Diagram) are very popular and useful for quality control in the apparel […]
Pareto Chart and Fishbone Diagram in Apparel Industry Read Post »
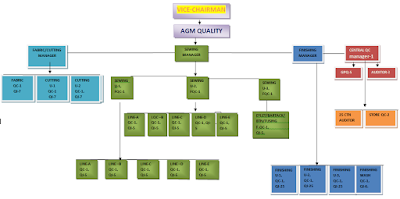
QA Organization Chart The organization chart is an Organogram that gives information about the management chain system. The organization chart
QA Organization Chart and Structure of Garments Industry Read Post »
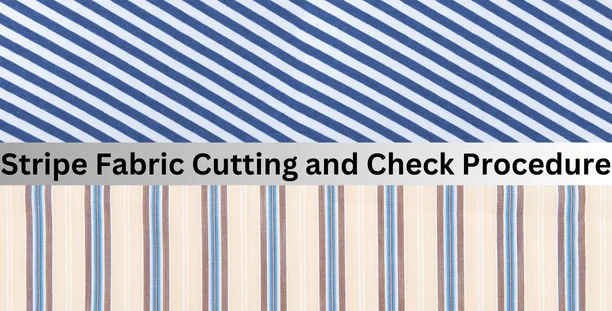
Stripe Fabric has some Stripe line marks in the fabrics. In order to produce clothing, those stripe marks have to match
Stripe Fabric Cutting and Check Procedure in Garments Industry Read Post »
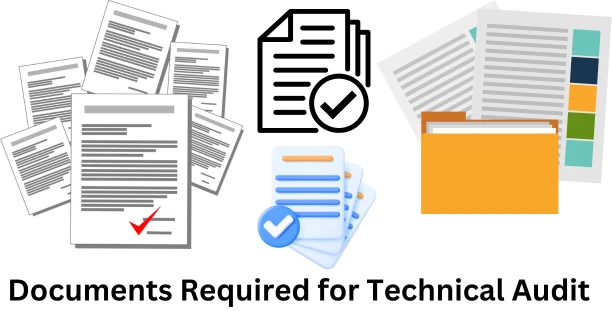
The Technical Audit covers documents, analysis, testing, and checking. For all these activities, the auditor needs to check a lot
List of Documents Required for Technical Audit in Garments Read Post »
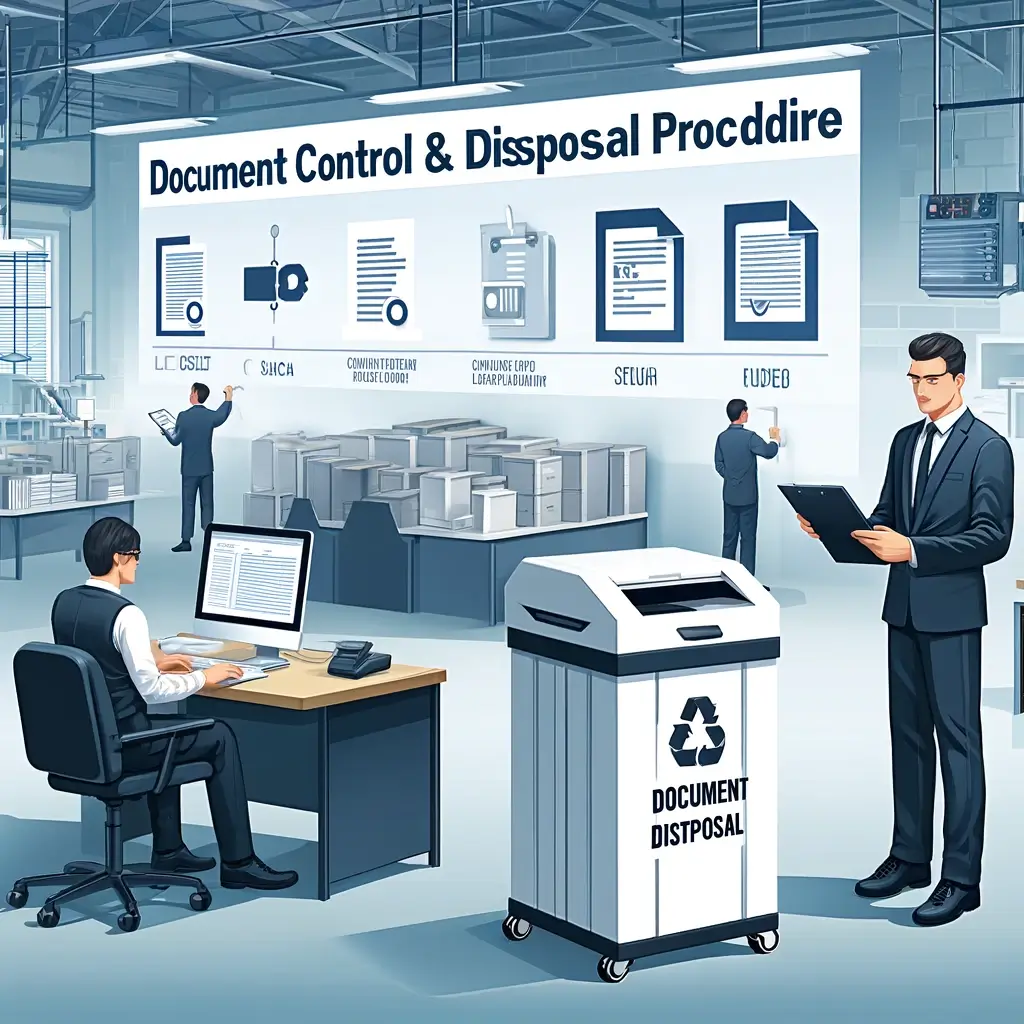
To establish a standardized procedure for managing and disposing of obsolete documents in compliance with organizational requirements, ensuring data security
Obsolete Documents Control & Disposal Procedure in Garments Industry Read Post »
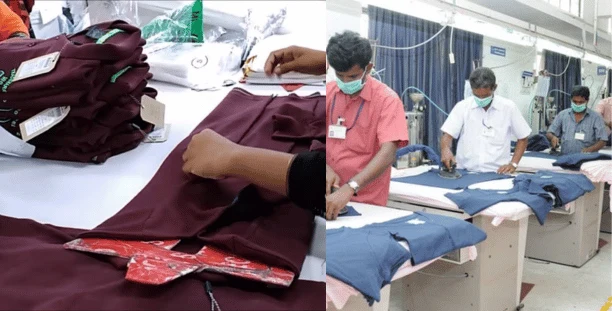
Garments Finishing Process The garment’s Finishing process includes many processes, including ironing, attaching ticketing, Folding, and Packing. Product quality, performance,
Process Flow Chart and Layout of Garments Finishing Process Read Post »