
Traffic Light Chart System for In-line Quality Inspection in the Garment Industry
Traffic Light Chart System:
This is a dependable modern system of in-line process inspection that can demonstrate line quality visually. This system allows for identifying defects at the earliest stage of production and thus can offset increasing defects beyond limit. In this system, every operator is provided with a traffic light chart in front of her, The In-line inspector checks the lot or bundle completed by the operator. This results in early identification of defects, as fewer rejects are produced in this method, so the company profits from this system. The operators also benefit because they have to rework less and can produce more. In this article, we discuss the Traffic Light Chart System for In-line Quality Inspection in the Garment Industry.
Purpose of Using Traffic Light Chart:
The aim and purpose is to build in quality at the point and to quickly identify problem areas in order to reduce defects and to improve factory efficiency.
Also to measure Quality Performance as a % Age for:
- Each Operator
- Each Line
- Factory Overall
Composition of the chart:
Such a chart comprises four portions:
- 1st portion displays the aspects of inspection of the concerned operation;
- 2nd portion displays the result of the inspection through a red, yellow & green color system;
- 3rd portion shows fault code.
- 4th portion gives analysis of defect & remark (fault analysis & remark)
The usefulness of Traffic Light Chart System
Traffic Light Chart is so installed in front of an operator that it is displayed to the all concerned. So the operator, supervisor, floor-in-charge, and quality controllers are aware of the level of the quality of operations on the floor. This chart enables analysis of faults and identifies measures to rectify them. By using a traffic light chart the following analyses are generated.
1. Weekly Defect Levels:
This report shows the number of inspections & defects per line per day, % of defects, etc.
2. Weekly Defect Rates:
This report shows the weekly number of defects & rate of defects enabling analyses of the situation & thus eliminating causes of defects.
3. 7-Square Red Report
If 7 consecutive squares show red color in this report, this implies that there is serious problem related with quality. So the situation should be brought to the notice of higher authority. This report contains the type of operation & defect, the workmanship of the operator, time of occurrence of defect, etc.
4. Daily Highest 3 defects Report
This report is produced in consultation with the shell & lining inspection report as well as the Team repair level sheet. This report is submitted to higher management. The highest defect operations are kept under 100% surveillance until they are eliminated.
5. Team Repair Level Sheet
All the defects occurring in an operation are displayed in the traffic light chart. The line inspector puts up all the defects occurring on a certain day in the team repair level sheet. This report shows the quality situation of a line.
6. Check List
In order to conduct an in-line inspection of the shell, lining & final inspection, a clear checklist is prepared so that the line inspector can work with a clear idea.
Inspection Process:
- A roving quality inspector visits each workstation at designated intervals (e.g., hourly).
- The inspector randomly selects a set number of garments (e.g., 5) for inspection.
- Based on the number of defects found:
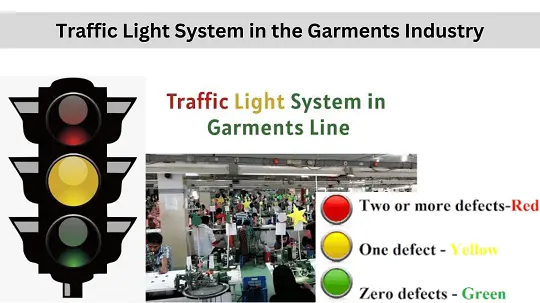
- Zero Defects: A green card is displayed, and a green mark is noted on the Traffic Light Chart.
- One Minor Defect: Yellow card is displayed, and a yellow mark is noted on the Chart.
- Two or More Defects: A red card is displayed, and a red mark is noted on the Chart.
Taking Action:
- Green: Production continues as usual.
- Yellow: The inspector informs the operator and supervisor to raise awareness about the potential quality issue.
- Red: Production may be halted at the station. The inspector and supervisor work with the operator to identify and fix the problem.
By implementing a Traffic Light Chart System, garment manufacturers can achieve significant improvements in their in-line quality control process.